The above figure shows the demand and cost curves facing a monopoly. If the firm is a profit maximizer, its Lerner Index will equal
A) 1.
B) 1/3.
C) 1.5.
D) 3.
B
You might also like to view...
A contractionary monetary policy ________.
A. shifts the aggregate supply curve to the left B. is used when the inflation rate is high C. is designed to increase aggregate demand D. can reduce the length of a recession
Figure 33-6
?
 Figure 33-6 (b) illustrates that
A. in the short run, it is possible to “ride the Phillips curve” down toward lower rates of inflation. B. in the short run, it is possible to “ride the Phillips curve” up toward lower unemployment by stimulating aggregate demand. C. the Phillips curve connecting points g, e, and r is not a menu of policy choices. D. All of these responses are correct.
Total revenue equals
a. marginal revenue - marginal cost. b. price/quantity. c. price x quantity. d. output - input.
In the graph shown, which of the world supply curves create a trade deficit?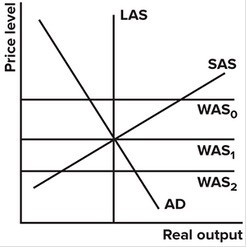
A. WAS0 B. WAS1 C. WAS2 D. None create deficits.