The data in the table above shows the relationship between the Joneses' total consumption and total household income. Based on these data, total consumption varies
A) directly with their total household income.
B) independently of their total household income.
C) inversely with their total household income.
D) negatively with their income.
A
You might also like to view...
Open-access resources tend to be
a. conserved b. taxed c. overused d. efficiently used e. used in an environmentally sound manner
Which of the following groups would have the lowest unemployment rates?
A. High-school dropouts B. Married men C. Nonwhite teenagers D. Nonwhite women
Refer to the graph below. Which curve shows a direct relationship between price and quantity?
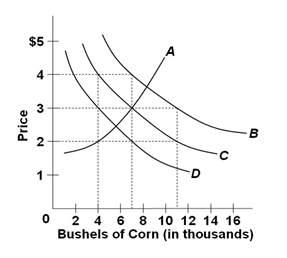
A. A
B. B
C. C
D. D
If both buyers and sellers expect the price of a commodity to rise in the future, it is likely that equilibrium:
A. price will fall with little change in equilibrium quantity. B. quantity will fall with little change in equilibrium price. C. quantity will rise with little change in equilibrium price. D. price will rise with little change in equilibrium quantity.