In the above figure, Mark's monthly budget line for movies and plays changed, as shown by the arrow. The change was caused by
A) a decrease in Mark's income.
B) an increase in Mark's income.
C) a fall in the price of a play.
D) a rise in the price of a play.
C
You might also like to view...
According to the above table, the marginal propensity to consume is
A) 0.8. B) 0.75. C) 0.5. D) 0.6.
Refer to the table below. If Sweet Grams is a perfectly competitive firm and the market price $1.75 per unit, what is the profit-maximizing quantity for Sweet Grams to produce at Plant 1?
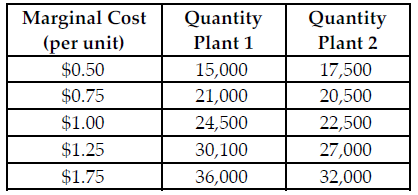
Sweet Grams makes graham cracker snack packages. Sweet Grams is a multi-plant firm with two production facilities. The above table summarizes the total marginal cost of production at various output levels in the separate plants. Assume Sweet Grams is a perfectly competitive firm.
A) 32,500
B) 36,000
C) 32,000
D) 30,100
The 45-degree line in the Keynesian income-expenditure graph indicates
a. the basic size of the spending flow. b. points where total output is equal to aggregate expenditure. c. the size of the multiplier. d. the size of the marginal propensity to save.
Assume you pay a premium of $0.50/bu for a put option with a strike price of $4.00/bu and that the current futures price is $3.75/bu. Then, the option is:
A. In-the-money B. At-the-money C. Out-of-the-money D. None of the above