 Refer to the above diagram. Discretionary fiscal policy designed to slow the economy is illustrated by:
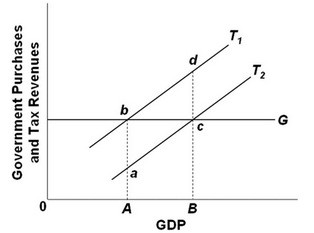
A. the shift of curve T1 to T2.
B. a movement from a to c along curve T2.
C. the shift of curve T2 to T1.
D. a movement from d to b along curve T1.
Answer: C
You might also like to view...
From the banker's perspective, dollars held as required reserves in bank vaults
A) earn a low rate of interest. B) earn no rate of interest. C) earn a market rate of interest. D) earn profits.
Imagine the U.S. economy is in long-run equilibrium. Then suppose the value of the U.S. dollar decreases. At the same time, people in the U.S. revise their expectations so that the expected price level rises. We would expect that in the short-run
a. real GDP will rise and the price level might rise, fall, or stay the same. b. real GDP will fall and the price level might rise, fall, or stay the same. c. the price level will rise, and real GDP might rise, fall, or stay the same. d. the price level will fall, and real GDP might rise, fall, or stay the same.
The Permanent Income and Life-Cycle Hypothesis imply that
A. the primary determinant of current consumption is permanent income. B. the primary determinant of permanent income is current consumption. C. consumers generally favor current consumption over future consumption. D. consumers are more likely to save if they are uncertain about the future.
The Gini coefficient for Algeria is about 0.4. How would this number be shown on a Lorenz curve?
A. The length of the Lorenz curve is 40 percent longer than the line of equality. B. It cannot be shown; the Lorenz curve and the Gini coefficient are alternative ways of measuring inequality. C. The area between the Lorenz curve and the line of absolute equality is 40 percent of the total area under the line of equality. D. The area between the Lorenz curve and the x-axis is 40 percent of the total area below the line of equality.