Refer to the accompanying figure. A decrease in supply is represented by a shift from: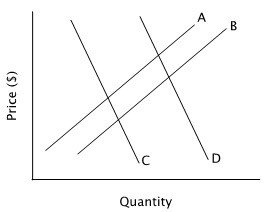
A. curve B to curve A.
B. curve D to curve C.
C. curve C to curve D.
D. curve A to curve B.
Answer: A
You might also like to view...
The figure above shows the market for coffee. If one firm owns all the coffee outlets and sells 10 million pounds of coffee a month
A) the market is efficient because the marginal social benefit from coffee exceeds its marginal social cost. B) the market is efficient because the total social benefit from coffee exceed the total social cost. C) there is a deadweight loss because the marginal social benefit from the last pound of coffee exceeds its marginal social cost. D) there is a deadweight loss because the marginal social cost of the last pound of coffee exceeds its marginal social benefit.
If AVC is $10 when P = MC, a firm
A) will have positive economic profits if price is greater than $10. B) is producing too little output. C) should shut down if price is less than $10. D) is experiencing economies of scale.
Evaluate the following statement: "The market price of a good reflects its highest-valued alternative use."
Indicate whether the statement is true or false.
A price index is
A. a measurement showing the cost of a bundle of goods at a point in time. B. a decrease in the overall price level. C. a sustained increase in the overall price level. D. a measurement showing how the average price of a bundle of goods changes over time.