Janine’s country is wealthy and has a large amount of capital. If her country adds a single unit of capital, the result will be a relatively ______ in output.
a. large decrease
b. minor decrease
c. large increase
d. minor increase
d. minor increase
You might also like to view...
The accompany diagram shows the market for gasoline, in which there are 1,000 consumers. Gasoline can be produced at a constant marginal cost of $2 per gallon. When the market is in equilibrium, the average consumer uses 15 gallons of gasoline per week.
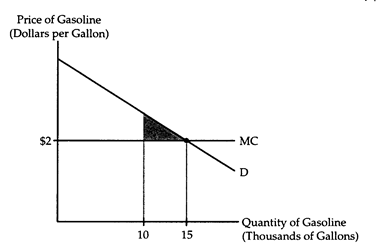
Suppose a war breaks out, temporarily limiting the amount of gasoline available for civilian use to 10,000 gallons per week. In the interest of fairness, the government allocates 10 gallons per week to each consumer, taxes each consumer $20 per week, and forbids barter in gasoline. Will the shaded area in the diagram accurately measure the loss in consumers' surplus? Why or why not?
Assume that Anne has $300 to spend on DVDs and CDs. Her optimal consumption of DVDs and CDs is illustrated by a tangency between a budget line and an indifference curve. Now assume that the price of CDs rises but the price of DVDs falls
How can you show that Anne is made better off by these price changes? A) Show that the price changes move Anne along her budget line to a higher indifference curve. B) Show that Anne can now afford to buy more DVDs, which give her greater utility than CDs. C) Show that the price changes shift Anne's budget line outward; the budget line is tangent to a higher indifference curve. D) Show that Anne can afford to buy the optimal combination of DVDs and CDs at their original prices; then show that Anne can now reach a higher indifference curve.
In the very short-run period,
a. the price elasticity of supply is very elastic. b. the price elasticity of demand is very elastic. c. the cross elasticity of demand is very inelastic. d. income elasticity is very elastic. e. the price elasticity of supply is very inelastic.
The percentage of households with a Head Start enrollee where no one in the household has a job is
A. 5%. B. 67%. C. 33%. D. 50%.