Draw a supply and demand graph on the below diagram that illustrates the market for pollution rights. Label the axes and curves. Then show what happens to price and quantity when the demand for pollution rights increases in the market
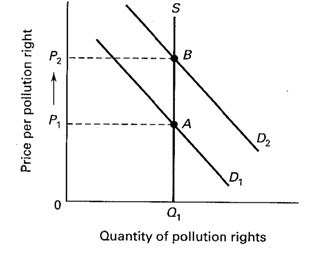
Demand increases from D1 to D2, which raises price from P1 to P2. The equilibrium moves from A to B. The quantity remains the same at Q1 because the supply of pollution rights is fixed by government in the market and perfectly inelastic at Q1.
You might also like to view...
If the exchange rate appreciates, then the
A) quantity of dollars demanded increases. B) demand for dollars decreases. C) quantity of dollars demanded decreases. D) demand for dollars increases. E) supply of dollars decreases.
The Economic Freedom Index includes which of the following measures of economic freedom within a nation?
A) Levels of economic regulation B) Freedom of pricing C) Stability of monetary policy D) Taxation levels E) All of the above.
Figure 4-20
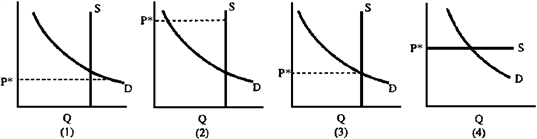
If there are empty seats at the university basketball game when the price per ticket is P*, then this situation can best be represented by which graph in Figure 4-20?
a.
1
b.
2
c.
3
d.
4
Suppose that the total production of an economy consists of 10 oranges and 5 candy bars, each orange sells for $0.20, and each candy bar sells for $1.00. What is the market value of production in this economy?
A. $1.20 B. $5.00 C. $7.00 D. $2.00