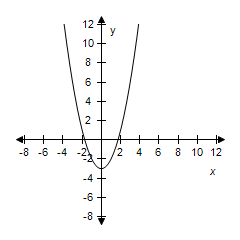
Use the graph of  to write an equation for the function whose graph is shown.
?
?
A. ![]()
B. ![]()
C. ![]()
D. ![]()
E. ![]()
Answer: D
Mathematics
You might also like to view...
Solve the problem.A data set consists of 248 test scores. Over a long period it has been found that the mean and standard deviation for these scores are known and that the scores are normally distributed. How many scores within this data set should lie within three standard deviations of the mean? Round your answer to the nearest whole number.
A. 237 B. 247 C. 169 D. 124
Mathematics
Evaluate.
A. 1.052 x 10¹³ B. 1.052 x 10¹² C. 2.104 x 10¹³ D. 1.052 x 10¹⁴
Mathematics
Write any percent as a decimal and any decimal as a percent.Attendance this year was 8.591 times greater than last year.
A. 859.1% B. 8591% C. 0.08591% D. 85.91%
Mathematics
Find the cofactor of the indicated element of the matrix shown.a33;
A. 4 B. 6 C. -4 D. -6
Mathematics