The figure above shows supply curves for soft drinks. Suppose the economy is at point a. An increase in the price of a soft drink is shown as a movement from point a to
A) none of the points that are illustrated.
B) point b.
C) point c.
D) point d.
D
You might also like to view...
In the above figure, the Lorenz curve for income is shown. If the data used are from the United States, and the U.S. Lorenz curve for wealth was added to the diagram, it would be
A) further from the line of equality than the Lorenz curve for income. B) closer to the line of equality than the Lorenz curve for income. C) above the line of equality. D) the same as the Lorenz curve for income.
Refer to the information provided in Figure 2.4 below to answer the question(s) that follow.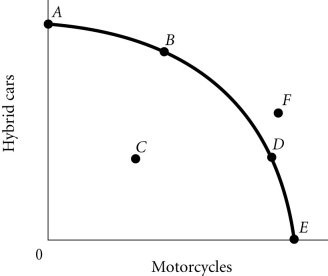 Figure 2.4According to Figure 2.4, as the economy moves from Point A to Point E, the opportunity cost of motorcycles, measured in terms of hybrid cars
A. remains constant. B. decreases. C. initially increases, then decreases. D. increases.
An emission charge is
A. An attempt to change consumers' behavior by direct government intervention. B. A fee imposed on polluters based on the quantity of pollution they generate. C. A subsidy to the consumers who are hurt by pollution. D. A charge on consumers who buy goods made by firms that pollute.
?Demand determined? means that price is set by buyers' demand and a fixed supply.
Answer the following statement true (T) or false (F)