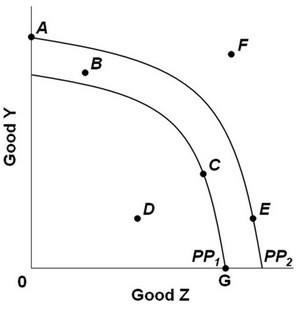
 The graph above shows two production possibilities curves for a nation that produces two goods, Y and Z. PP1 and PP2 show the production possibilities for years 1 and 2. The nation's total production then decreased after year 2. This change could be represented by a move from:
A. F to B.
B. E to D.
C. A to E.
D. F to A.
Answer: B
You might also like to view...
If the Fed promises to conduct a(n) ________ for several years, inflation expectation will be ________
A) contractionary fiscal policy; high B) expansionary monetary policy; high C) contractionary monetary policy; high D) expansionary fiscal policy; low
Governments sometime create an excess demand for a product by setting a maximum price that is less than the equilibrium price, resulting in a permanent excess demand for the product. This is known as a price floor
Indicate whether the statement is true or false
An effective price floor must be set
A. either at or below the equilibrium price. B. at the equilibrium price. C. above the equilibrium price. D. below the equilibrium price.
As a result of adverse selection problems in the health insurance market, it is likely that over time
A. fewer healthy and unhealthy people will be insured. B. more healthy people will be insured. C. fewer unhealthy people will be insured. D. fewer healthy people will be insured.