Refer to the above figure. Suppose point A is the original equilibrium. If there is an increase in the money supply, the new long-run equilibrium is given by point
A) A. B) B. C) C. D) D.
C
You might also like to view...
Use the following graph showing cost curves for a perfectly competitive firm to answer the next question.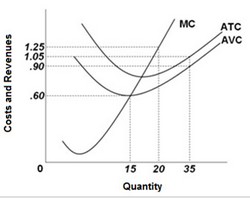 If the market price decreases to $0.55, the profit-maximizing quantity of output is
A. 0. B. more than 20, but less than 35. C. 20. D. 15.
A dominant strategy:
A. exists in every game. B. is the best one to follow no matter what strategy other players choose. C. is always the same for all players of a game. D. awards the highest achievable payoff in a game.
If the minimum points of all the possible short-run average total cost curves become successively lower as quantity of output increases, then:
a. the firm should try to produce less output. b. total fixed costs are constant along the LRAC curve. c. there are economies of scale. d. the firm is probably having significant management problems. e. when output is doubled, total costs are doubled.
An increase in the quantity demanded is shown by
A. a movement up along a demand curve. B. a leftward shift of the demand curve. C. a rightward shift of the demand curve. D. a movement down along a demand curve.