The stack plot below shows the value of each of Danny's investments. The stack plot contains three regions. The uppermost unshaded region represents the value of Danny's investment in individual stocks. The center shaded region represents the value of Danny's investment in mutual funds and the bottom region in black represents the value of Danny's investment in a CD. The thickness of a region at a particular time tells you its value at that time.  Use the graph to answer the question.In which year was the value of Danny's investment in individual stocks the highest?
A. year 0
B. year 8
C. year 4
D. year 5
Answer: A
Mathematics
You might also like to view...
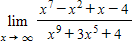
Find the limit.
?
 ?
?
A. 
B. 
C. 
D. 
E. 
Mathematics
Factor the sum or difference of two cubes completely.z9 + 1
A. (z + 1)(z2 - z + 1)(z6 - z3 + 1) B. (z - 1)(z + 1)(z6 - z3 + 1) C. (z3 + 1)(z6 - z3 + 1) D. (z - 1)(z2 + z + 1)(z6 + z3 + 1)
Mathematics
Determine the value of each variable. =
= 
A. m = -14; n = -2; x = -1 B. m = 2; n = 14; x = 0 C. m = 10; n = 6; x = 1 D. m = 14; n = 2; x = 1
Mathematics
Express the given function H as a composition of two functions f and g such that H(x) = (f ? g)(x).H(x) = 
A. f(x) =  , g(x) = 6
B. f(x) = 6, g(x) = 
C. f(x) =  , g(x) = 3x + 3
D. f(x) =  , g(x) = 3x + 3
Mathematics