Make the following length or weight conversion between the U.S. and the metric system.237 miles to kilometers (Round to the nearest thousandth.)
A. 381.333 km
B. 147.296 km
C. 131.667 km
D. 428.733 km
Answer: A
You might also like to view...
Provide an appropriate response.The parallel dot plots show the number of fatalities per year caused by tornadoes in a certain state for two periods: 1950-1974 and 1975-1999. In addition to comparing these distributions, suggest a reason to explain any differences. 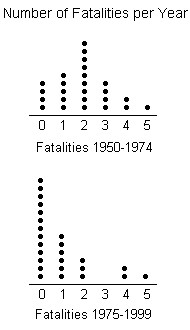
A. In both periods, the number of fatalities per year ranges from 0 to 5. During the period 1950-1974, the most common number of fatalities was 2. The distribution for this period is roughly symmetric - the number of years having more than 2 fatalities is roughly the same as the numbers of years having fewer than 2 fatalities. During the period 1975-1999, the most common number of fatalities is 0 and most years have 0 or 1 fatality. Only a few years have more than 1 fatality during this period. This could be due to higher construction standards, better warning systems, or medical advancements. B. In both periods, the number of fatalities per year ranges from 0 to 5. During the period 1950-1974, the most common number of fatalities was 2. The distribution for this period is roughly symmetric - the number of years having more than 2 fatalities is roughly the same as the numbers of years having fewer than 2 fatalities. During the period 1975-1999, the most common number of fatalities is 1 and most years have 1 or 2 fatalities. Only a few years have more than 2 fatalities during this period. This could be due to higher construction standards, better warning systems, or medical advancements. C. During the period 1950-1974, the number of fatalities per year ranges from 1 to 5 with the most common number of fatalities being 2. The distribution for this period is roughly symmetric - the number of years having more than 2 fatalities is roughly the same as the numbers of years having fewer than 2 fatalities. During the period 1975-1999, the number of fatalities per year ranges from 0 to 5 with the most common number of fatalities being 0. During this period, most years have 0 or 1 fatality and only a few years have more than 1 fatality. This could be due to higher construction standards, better warning systems, or medical advancements. D. In both periods, the number of fatalities per year ranges from 0 to 5. During the period 1950-1974, the most common number of fatalities was 3. The distribution for this period is roughly symmetric - the number of years having more than 3 fatalities is roughly the same as the numbers of years having fewer than 3 fatalities. During the period 1975-1999, the most common number of fatalities is 0 and most years have 0 or 1 fatality. Only a few years have more than 1 fatality during this period. This could be due to higher construction standards, better warning systems, or medical advancements.
Find an equation of the line with the given slope and containing the given point. Express your answer in slope-intercept form.m = -2, (-4, -5)
A. y + 5 = x + 4 B. y + 5 = mx + 4 C. y = -2x - 13 D. y = -2x + 13
Solve the equation. Express radicals in simplest form.7z2 + 3 = 346
A. {-8, 8} B. {173} C. {-7, 7} D. {7}
Plot the given point in a rectangular coordinate system.(-4, 5)
A. 
B. 
C. 
D. 