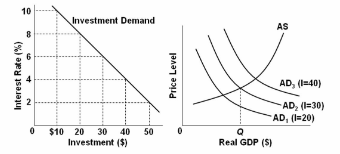
Refer to the diagrams. The numbers in parentheses after the AD 1 , AD 2 , and AD 3 , labels indicate the levels of investment spending associated with each curve, respectively. All numbers are in billions of dollars. If the interest rate is 8 percent and the goal of the Fed is full- employment output of Q f , it should:
A. increase the interest rate from 8 percent to 10 percent.
B. decrease the interest rate from 8 percent to 4 percent.
C. decrease the interest rate from 8 percent to 6 percent.
D. maintain the interest rate at 8 percent.
C. decrease the interest rate from 8 percent to 6 percent.
You might also like to view...
Higher real income ________ the demand for money and a higher price level ________ the demand for money.
A. increases; increases B. decreases; decreases C. increases; decreases D. decreases; increases
Competitive offers to buy and sell resources establish money prices, which reflect relative scarcities
A) in all economic systems. B) in any economic system where efficiency is important. C) only when there are no sunk costs to be recovered. D) when resources are privately owned.
Private property was argued to be inappropriate by Marxists due to its distribution from those "who have" to those "who will have" in a fashion creating a class to itself
Indicate whether the statement is true or false
A company currently pays a dividend of $4.00 per share. It expects the growth rate of the dividend to be 3% (0.03) annually. If the interest rate is 6% (0.06) what does the dividend- discount model predict the current price of the stock should be?
A. $ 137.33 B. $103.33 C. $66.67 D. it doesn't, you need an expected future selling price to use the model.