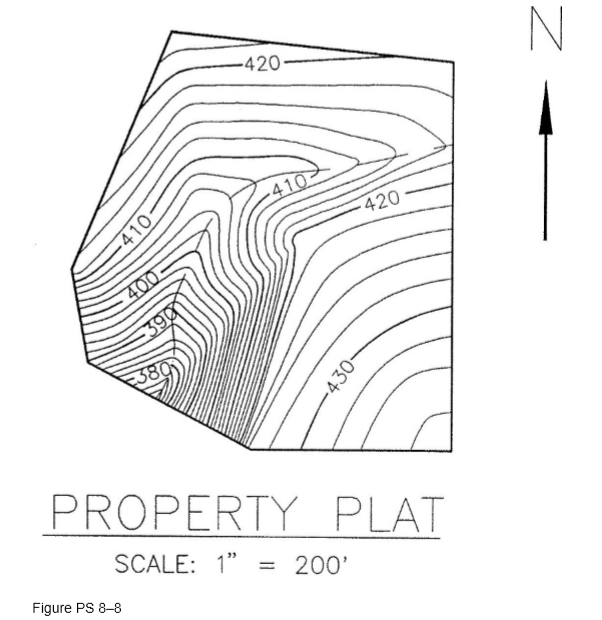
Draw the property plat shown in Figure 8–19. Add contour lines using the survey data shown in Figure P8–8. The points correspond to the points in the Figure 8–19 field notes. Use a 2? contour interval. Plot the drawing at an appropriate scale on an appropriate sheet size.
What will be an ideal response?
See Figure PS8–8.
Trades & Technology
You might also like to view...
____ testing determines the stress level a metal can withstand without failure when subjected to an infinitely large number of repeated alternating stresses.
A. Tensile B. Hardness C. Impact D. Fatigue
Trades & Technology
When drawn using AutoCAD, the individual slats of the shutter can be placed using the ____ commands.
A. COPY or ARRAY B. COPY or BLOCK C. ARRAY or BLOCK D. COPY or FORM
Trades & Technology
FIC-202 is typically set at :
a. 125 GPM b. 50 GPH c. 225 GPS d. 225 GPM
Trades & Technology
What is the difference between a nonselective and a selective herbicide?
What will be an ideal response?
Trades & Technology