Graph the equation.x = -2(y - 1)2 + 2
A. 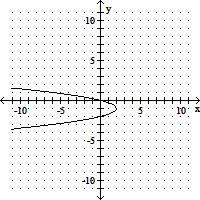
B. 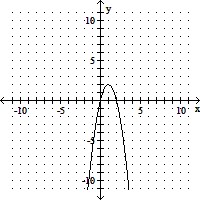
C. 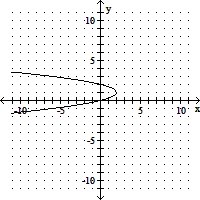
D. 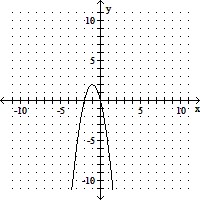
Answer: C
You might also like to view...
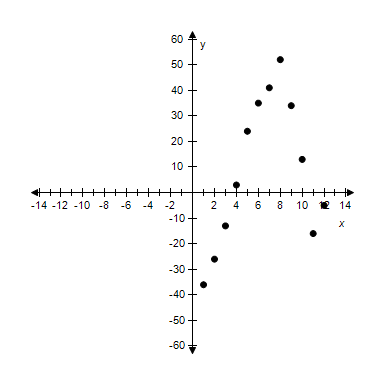
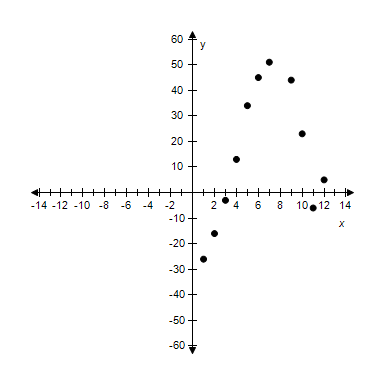
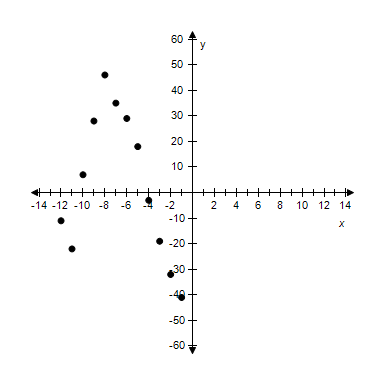
Sketch a scatter plot of the data shown in the table.The table shows the lowest temperature on record y (in degrees Fahrenheit) in Duluth, Minnesota for each month x where x = 1 represents from January. Months, x Temperature, y 1 -46 2 -36 3 -23 4 -7 5 14 6 25 7 31 8 42 9 24 10 3 11 -26 12 -15
A. 
x: Months (1 ? January)
y: Temperature (in Fº)
B.
x: Months (1 ? January)
y: Temperature (in Fº)
C.
?
x: Months (1 ? January)
y: Temperature (in Fº)
D.
?
x: Months (1 ? January)
y: Temperature (in Fº)
E.

x: Months (1 ? January)
y: Temperature (in Fº)
Graph the function.f(x) = 

A. 
B. 
C. 
D. 
Determine the maximum possible number of turning points for the graph of the function.f(x) = (x - 5)(x - 3)(x + 7)(x + 4)
A. 1 B. 0 C. 4 D. 3
? is a central angle that cuts off an arc of length s. Find the radius of the circle if ?= 10, s = 4 ft. ? If the answer needs rounding, round it to three significant digits. ? r = __________ ft
Fill in the blank(s) with the appropriate word(s).