Graph the function.f(x) = x3 + 1
A. 
B. 
C. 
D. 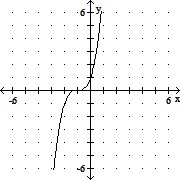
Answer: B
Mathematics
You might also like to view...
Evaluate the expression, if possible. 2/3
2/3
A. 
B. 
C. 
D. - 
Mathematics
Provide an appropriate response.A graph designed to quickly illustrate to the reader whether a set of data is increasing, decreasing, or fluctuating is a:
A. range graph B. bar graph C. circle graph D. line graph
Mathematics
Perform the indicated operations and simplify the expression.
?

What will be an ideal response?
Mathematics
Solve the inequality. Graph the solution set and write the solution set in set-builder notation.x2 - 3x - 10 < 0![]()
A. {x|x < -2 or x > 5}![]()
B. {x|x < -2}![]()
C. {x|x > 5}![]()
D. {x|-2 < x < 5}![]()
Mathematics