The chart below shows the percentage of people in a questionnaire who bought or leased the listed car models and were very satisfied with the experience. Model A 81%Model B 79%Model C 73%Model D 61%Model E 59%Model F 57%With which model was the greatest percentage satisfied? Estimate the empirical probability that a person with this model is very satisfied with the experience. Express the answer as a fraction with a denominator of 100.
A. Model A: 
B. Model F; 
C. Model A; 
D. Model F; 
Answer: C
You might also like to view...
Graph the function.f(x) = ln(x + 3) 
A. 
B. 
C. 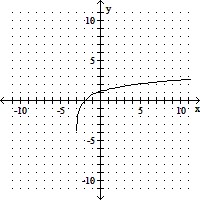
D. 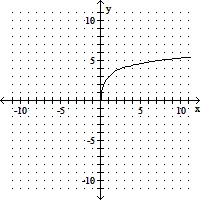
Provide an appropriate response.Use the Intermediate Value Theorem to prove that 2x3 - 7x2 - 9x + 4 = 0 has a solution between 4 and 5.
What will be an ideal response?
Use the sum-of-the-years'-digits method of depreciation. Round to the nearest dollar.Find the book value at the end of the third year for a service van which cost $16,000, has a life of 8 years, and an estimated scrap value of $1,600.
A. $8,400 B. $6,000 C. $10,000 D. $7,600
Solve the problem.Marty's Tee Shirt & Jacket Company is to produce a new line of jackets with a embroidery of a Great Pyrenees dog on the front. There are fixed costs of $580 to set up for production, and variable costs of $30 per jacket. Write an equation that can be used to determine the total cost, C(x), encountered by Marty's Company in producing x jackets, and use the equation to find the total cost of producing 147 jackets.
A. $5002 B. $4982 C. $4990 D. $4970