Use a Venn Diagram and the given information to determine the number of elements in the indicated region.At Southern States University SSU) there are 719 students taking Finite Mathematics or Statistics. 328 are taking Finite Mathematics, 476 are taking Statistics, and 85 are taking both Finite Mathematics and Statistics. How many are taking Statistics but not Finite Mathematics?
A. 243
B. 158
C. 391
D. 634
Answer: C
Mathematics
You might also like to view...
Use the distributive property to write without parentheses.- (3x + 3y)
A. 3x + 3y B. 3x - 3y C. -3x + 3y D. -3x - 3y
Mathematics
Find the distance d(P1, P2) between the points P1 and P2.P1 = (0, 10); P2 = (5, 10)
A. 5
B. 10
C. 25
D. 5
Mathematics
Find the product.
A. 170,000 B. 160,000 C. 159,000 D. 161,000
Mathematics
Graph the inequality.y ? x2 + 6
A. 
B. 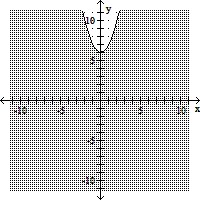
C. 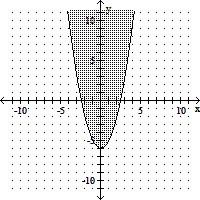
D. 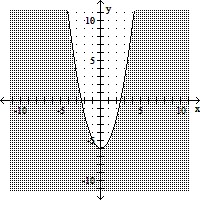
Mathematics