What does this graph show?
A) It shows calculations indicating that the temperature of the universe began quite high but is now quite low.
B) It shows that the temperature of the universe began quite low but is now quite high.
C) It shows that the temperature of the universe has changed diagonally with time.
D) It shows evidence that the Big Bang really happened.
A) It shows calculations indicating that the temperature of the universe began quite high but is now quite low.
You might also like to view...
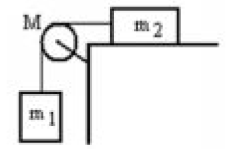
A mass  is connected by a light string that passes over a pulley of mass M to a mass
  sliding on a frictionless horizontal surface as shown in the figure. There is no slippage between the string and the pulley. The pulley has a radius of 25.0 cm and a moment of inertia of 1?2
  If m1 is 1.00 kg,
  is 2.00 kg, and M is 4.00 kg, then what is the tension in the string attached to
  ?
?
A. 3.92 
B. 3.65
C. 3.23
D. 3.02
E. 2.98
Neglecting air resistance, how fast must you toss a ball straight up in order for it to take 6 seconds to return to its initial level?
A) 5 m/s B) 10 m/s C) 20 m/s D) 30 m/s E) more than 30 m/s
Stable nuclei with mass numbers greater than 40 have
A) M > N + Z. B) M < N + Z. C) Z > N. D) N > M. E) N > Z.
A Young's double-slit apparatus is set up where a screen is positioned 0.80 m from the double slits. If the distance between alternating bright fringes is 0.83 cm, and the light source has a wavelength of 580 nm, what is the separation of the double slits? (1 nm = 10-9 m)
a. 6.0 × 10^-5 m c. 4.9 × 10^-5 m b. 2.8 × 10^-5 m d. 5.6 × 10^-5 m