Using Figure 1 above, if the aggregate demand curve shifts from AD3 to AD2 the result in the long run would be: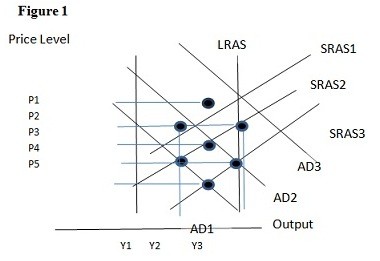
A. P1 and Y2.
B. P2 and Y1.
C. P3 and Y1.
D. P3 and Y2.
Answer: D
You might also like to view...
Refer to Figure 4-7. The figure above represents the market for iced tea. Assume that this is a competitive market. At an output of 30,000 units
A) the marginal cost of iced tea is greater than the marginal benefit; therefore, output is inefficiently high. B) producers should raise the price to $3 in order to sell the quantity demanded of 30,000. C) the marginal benefit of iced tea is greater than the marginal cost; therefore, output is inefficiently high. D) the marginal benefit of iced tea is greater than the marginal cost; therefore, output is inefficiently low.
Figure 3-17
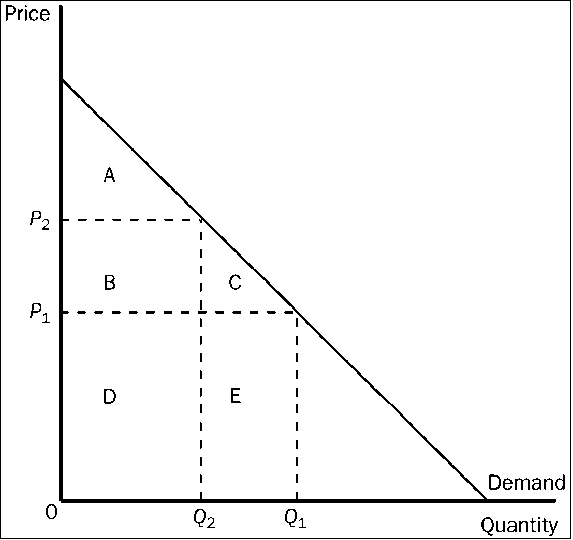
Refer to . When the price rises from P1 to P2, consumer surplus
a.
increases by an amount equal to A.
b.
decreases by an amount equal to B + C.
c.
increases by an amount equal to B + C.
d.
decreases by an amount equal to C.
v
Studies by economists have tended to show that countries with more independent central banks have:
A. more inflation. B. less inflation. C. higher unemployment. D. lower unemployment.
Among countries with per capita GDP in 2006 of greater than $24,000,
A. governments tend to be repressive and corrupt. B. the political structure tends to be relatively democratic. C. tax rates tend to be extremely high. D. all of the options are correct.