Use the given table or graph to write the inequality described.The bar graph below shows the number of students by major in the College of Arts and Sciences.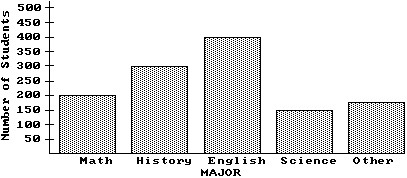 Use an inequality to compare the number of math and english majors.
A. 400 > 200
B. 300 > 200
C. 300 < 400
D. 200 > 150
Answer: A
Mathematics
You might also like to view...
Find a pattern and use it to solve the problem.How many line segments are used in the next figure?
A. 30 B. 24 C. 27 D. 36
Mathematics

Find the volume generated by revolving about the x-axis the regions bounded by the following graphs.
Mathematics
Find the relative maxima and relative minima, if any, of the function.
?
 ?
?
A. Relative maximum:  , No relative minima
B. Relative minimum:  , Relative maximum:
C. No relative maxima, Relative minimum: 
D. No relative maxima or minima.
Mathematics
Write the decimal as a fraction or mixed number in lowest terms.6.4
A. 6
B. 
C. 6
D. 
Mathematics