Discuss how a market reaches equilibrium. How is it expressed graphically?
Equilibrium exists at that one price in a market where the quantity demanded equals the quantity supplied. This is shown graphically at the point of intersection between demand and supply curves. At any price above equilibrium, a surplus is observed, which pushes the price down until equilibrium is established. Any price below equilibrium creates a shortage and the price rises until the shortage is eliminated.
You might also like to view...
Based on the figure below. Starting from long-run equilibrium at point C, a tax cut that increases aggregate demand from AD to AD1 will lead to a short-run equilibrium at point ________ and eventually to a long-run equilibrium at point ________, if left to self-correcting tendencies. 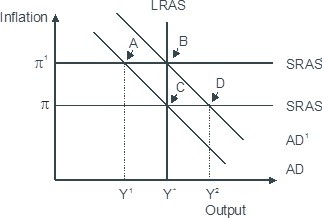
A. D; C B. B; C C. B; A D. D; B
The relationship between tax rates and tax revenues is shown on the
A) IRS curve. B) production possibilities frontier. C) Laffer curve. D) Discretionary Spending curve.
Which of the following is NOT true of moral hazard?
A) It would not exist in a world of perfect information. B) It arises because borrowers typically know more than lenders. C) It describes a lender's problem of distinguishing the good-risk applicants from the bad-risk applicants. D) It describes a lender's problem in verifying borrowers are using their funds as intended.
The main distinction between loanable funds and capital equipment is that
a. capital equipment has a measurable productivity, while loanable funds do not b. capital equipment is less divisible and unalterable in the short run c. loanable funds have an associated price (the interest rate), while capital equipment does not d. capital equipment may earn rents in production, while loanable funds do not e. there are no opportunity costs associated with the investment in capital equipment