The average enrollment E at a nearby school t years after 2010 is given by the following table. Use an exponential model for these data to determine the yearly percentage decrease in enrollment each year since 2010. Round your answer to two decimal places.
t 0 1 2 3 E 756.00 672.84 598.83 532.96?
A. 11.00%
B. 14.00%
C. 89.21%
D. 89.00%
Answer: A
You might also like to view...
The ______ forecast is the most important ingredient of the financial forecasting process. If this forecast is inaccurate, the consequences to the forecasting firm can be serious.
A. expense B. external financing C. sales D. accounts receivable E. accounts payable
Fill in the blank with the correct inequality symbol.If x < 2, then -3x  -6.
-6.
A. > B. ? C. ? D. <
Read the English dial (the arrow near the zero indicates the initial deflection of the needle).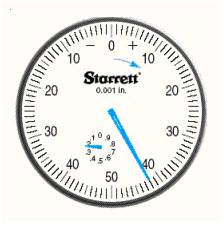
A. 0.242 in. B. 2.42 in. C. -2.42 in. D. -0.242 in. E. 0.342 in.
Graph the function defined by a radical expression. Give the domain and range.y = 6 
A. Domain: [-4, 4];
Range: [0, 6]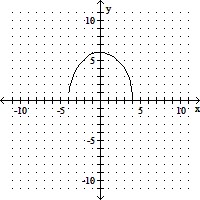
B. Domain: [-4, 4];
Range: [-6, 0]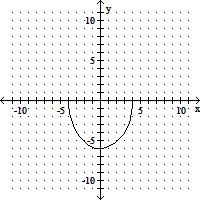
C. Domain: [0, 4];
Range: [-6, 6]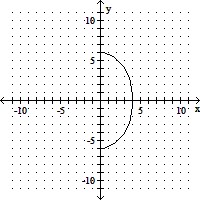
D. Domain: (-?, ?);
Range: [6, ?)