Refer to the provided supply and demand graph for a product. In the graph, line S is the current supply of this product, while line S1 is the optimal supply from the society's perspective. This figure suggests that there is (are)
A. external costs in the production of this product.
B. positive externalities from producing the product.
C. external benefits from the production of this product.
D. currently an underallocation of resources toward producing this product.
Answer: A. external costs in the production of this product.
You might also like to view...
Define transfer payments and explain why they are not included in the government purchases section of the GDP accounts
What will be an ideal response?
In the figure above, if the exchange rate is equal to 2 Canadian dollars per U.S. dollar, there is a ________ of ________currency and the exchange rate will________
A) surplus; domestic; fall B) surplus; foreign; fall C) surplus; domestic; rise D) shortage; domestic; fall
One of the most important determinants of a good's price elasticity of demand is
A) the profits of suppliers. B) the numbers of buyers in the market. C) the ease with which consumers can substitute other goods for that product. D) the cost of producing the good.
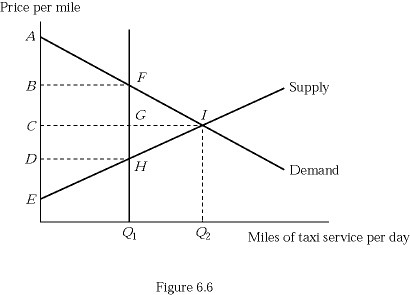 Refer to Figure 6.6, which shows a market for taxi medallions. Without any limit to the number of medallions (taxi licenses), the consumer surplus from consuming taxicab services is represented by:
A. area ABF. B. area ACI. C. area DEH. D. area CEI.