Use the graph below to identify the efficiency loss when there is underproduction (Q1) and the efficiency loss when there is overproduction (Q3) in a market
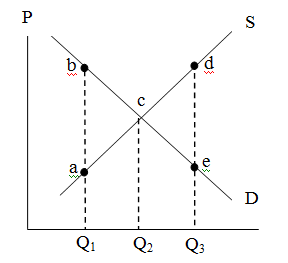
The efficiency loss from underproduction at Q1 would be the triangular area abc. The efficiency loss from underproduction at Q3 would be the triangular area cde.
You might also like to view...
A movement along the consumption function shows the change in consumption expenditure as a result of a change in
A) disposable income. B) the interest rate. C) net taxes. D) the price level. E) saving.
When the consumer price index falls, the typical family
a. has to spend more dollars to maintain the same standard of living. b. can spend fewer dollars to maintain the same standard of living. c. finds that its standard of living is not affected. d. can save less because they do not need to offset the effects of rising prices.
Figure 11-3
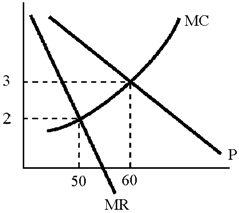
In Figure 11-3, one can tell from the graph that the monopolist will earn a positive profit only if
a.
the price exceeds $3.
b.
the price exceeds $2.
c.
output is less than 60 units.
d.
One cannot tell from the information given.
A decrease in the average level of prices of goods and services is known as:
a) A recession. b) The business cycle. c) Deflation. d) Inflation.