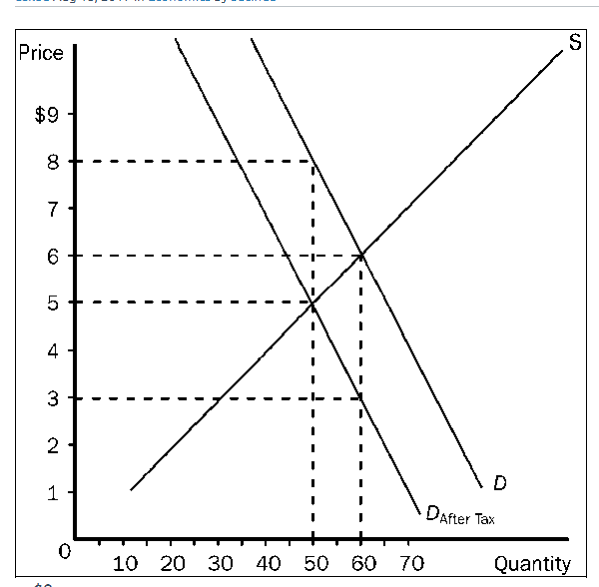
a. $8.
b. $6.
c. $5.
d. $3..
b. $6.
c. $5.
d. $3..
A) between point a and point b
B) between point c and point d
C) between point d and point e
D) at point e
A
A market demand curve shows how the total quantity demanded of a good varies as
a. income varies. b. price varies. c. price of the nearest substitute good varies. d. supply varies.
Refer to Figure 6-25. The equilibrium price in the market before the tax is imposed is.
The ratio of the total amount of demand deposits at a bank to the amount kept as cash reserves is known as the:
A. reserve ratio. B. demand-reserve ratio. C. federal funds rate. D. demand deposit ratio.
Gross domestic product is a measure of
A. the dollar value of the aggregate measure of business as measured by the Dow Jones Industrial Average. B. the total value of all transactions in U. S. markets. C. the dollar value of final goods and services produced in the United States. D. the added value of production.