Exhibit 3-2 Demand curves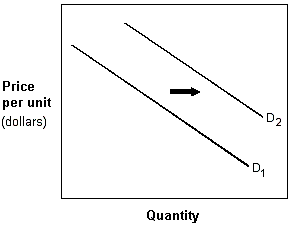
In Exhibit 3-2, the shift in the demand curve from D1 to D2 could have been caused by which of the following?
A. Decrease in price.
B. Increase in expected future prices.
C. Increase in the price of a complement.
D. Decrease in income if it is a normal good.
Answer: B
You might also like to view...
If a firm is using optimal input proportions, it is minimizing its costs.
Answer the following statement true (T) or false (F)
If the desired reserve-deposit ratio is 0.25 and the banking system receives an additional $10 million in reserves, bank deposits will increase by:
A. $40 million. B. $4 million. C. $10 million. D. $250 million.
Which of the following is true when an economy is in long-run equilibrium?
What will be an ideal response?
Which of the following statements is FALSE?
A. The value of total income is equal in value to total output because profit is a cost of production. B. Businesses sell goods and services to households who use their income to pay for them. C. Total income is always greater than total output. D. In the circular flow model, households sell factor services to businesses in return for factor payments.