Solve the problem.The following data represents the average percent of possible sunshine for a certain city in Indiana. 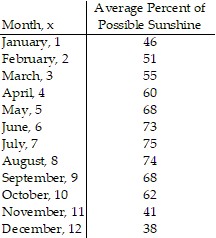 Draw a scatter diagram of the data for one period. Find the sinusoidal function of the form
 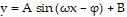 that fits the data. Draw the sinusoidal function on the scatter diagram. Use a graphing utility to find the sinusoidal function of best fit. Draw the sinusoidal function of best fit on the scatter diagram.
What will be an ideal response?
y = 15.99 sin (0.57x - 2.29) + 60.62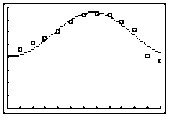
Mathematics
You might also like to view...
Perform the indicated operation.(2n5 - 19n4 - 17) - (5n5 - 2n4 + 13)
A. -3n5 - 14n4 - 4 B. -50n9 C. -3n5 - 17n4 - 4 D. -3n5 - 17n4 - 30
Mathematics
Find the indicated matrix.Let A =  . Find 4A.
A. 
B. 
C. 
D. 
Mathematics
Solve and write interval notation for the solution set.|13x + 5| < 0
A. No solution
B.  ?
? 
C. - 
D. (-?, ?)
Mathematics
Solve the problem.The radius of the circular top or bottom of a tin can with a surface area S and a height h is given by 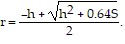 What radius should be used to make a can with a height of 24 inches and a surface area of 1600 square inches?
A. 32 inches B. 10 inches C. 8 inches D. 11 inches
Mathematics