Which of the following is graphed as a horizontal line across levels of real GDP in the aggregate expenditures model?
A. The saving schedule
B. The investment schedule
C. The consumption schedule
D. The investment demand curve
B. The investment schedule
You might also like to view...
If the official unemployment rate increases from December to January because the Christmas season is over, we can conclude that _____ is responsible for the increase
a. seasonal unemployment b. cyclical unemployment c. structural unemployment d. frictional unemployment e. underemployment
Briefly describe the business practice of tying
Figure 4-17
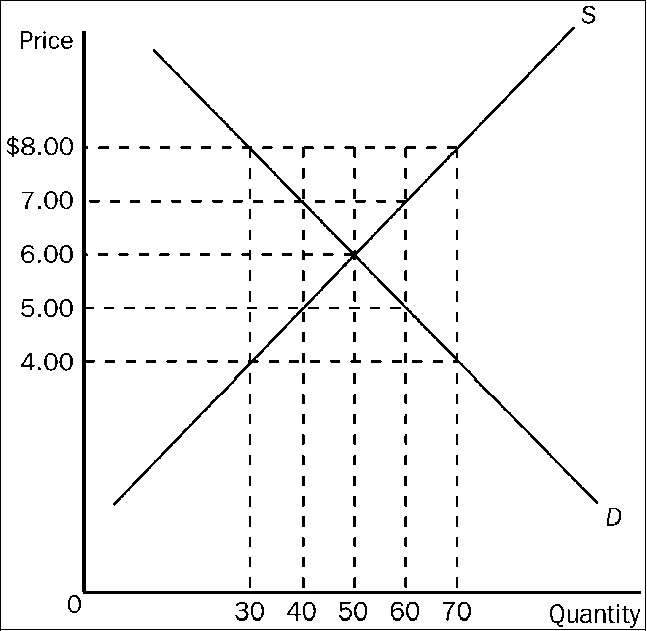
Refer to . Which of the following price controls would cause a shortage of 10 units of the good?
a.
a price ceiling of $5.50
b.
a price floor of $5.50
c.
a price ceiling of $6.50
d.
a price floor of $6.50
Real GDP per person in Richland is $20,000, while real GDP per person in Poorland is $10,000. However, Richland's real GDP per person is growing at 1 percent per year, and Poorland's real GDP per person is growing at 2 percent per year. After 50 years, real GDP per person in Richland minus real GDP in Poorland is:
A. positive and greater than $10,000. B. negative. C. zero. D. positive but less than $10,000.