Use the graph to answer the question.The following time-series diagram tracks the performance of two stocks during the month of October.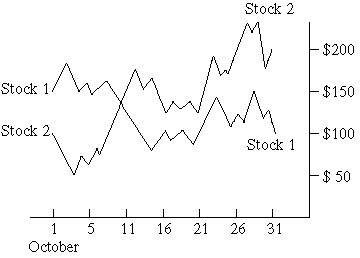 Describe the overall trend in the value of each stock during the month of October. By what percentage did the value of each stock increase or decrease during the month of October?
What will be an ideal response?
The value of stock 1 fluctuated during days 1-8 then fell sharply from days 8-14. From days 14 to 20 its value fluctuated with little overall change. From day 20 to 23 its value increased. For the remainder of the month its value fluctuated with little overall change. Overall the value of stock 1 fell by 33% during the month of October.
The value of stock 2 fell sharply during days 1-3 then increased sharply during days 3-13. Between days 13 and 16 its value fell. Between days 16 and 21 its value fluctuated with little overall change. Between days 21 and 29 its value increased overall with some fluctuations. On day 30 its value fell.
Overall, the value of stock 2 increased by 100% during the month of October.
You might also like to view...
Solve the problem.A conical tank is resting on its apex. The height of the tank is  , and the radius of its top is
  . The tank is full of gasoline weighing
  How much work will it take to pump the gasoline to a level
  above the cone's top? Give your answer to the nearest ft ? lb.
A. 184,726 ft ? lb B. 36,945 ft ? lb C. 344,821 ft ? lb D. 73,890 ft ? lb
Use the linearization of the function to approximate the value of the function. Give your answer in the form indicated. Give your answer as a decimal. Round to 4 decimal places if necessary.
A. 11.0000 B. 12.0417 C. 11.9167 D. 11.9583
Using a graphing calculator to graph f and g in the window [0, 6, 1] by [0, 6, 1]. Which function is greater when  ?f(x) = x1/2, g(x) = x1/6
A. g(x) B. f(x)
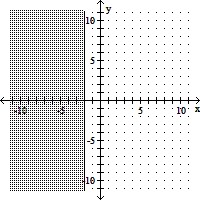
Graph the linear inequality.y ? -2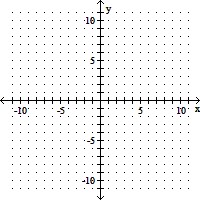
A. 
B. 
C. 
D.