Refer to the information provided in Figure 2.4 below to answer the question(s) that follow.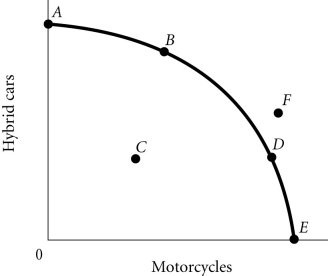 Figure 2.4According to Figure 2.4, Point F
A. is efficient and attainable.
B. cannot be produced with the current state of technology.
C. represents underallocation of resources.
D. represents what the people want.
Answer: B
You might also like to view...
According to your textbook authors, the growth rates in sub-Saharan Africa (excluding South Africa) have been plagued
A) exclusively by economic problems. B) exclusively by political problems. C) by meteorological and geographical problems. D) by purchasing power parity problems.
Which of the following statements is true?
A. Special interest groups are more likely to push for policies that increase the size of the economic pie than to increase their slice of the pie. B. Special interest groups are likely to push for policies that increase the size of their slice of the economic pie even if it means that the overall size of the economic pie will shrink. C. Special interest groups are more likely to favor policies that increase the size of their slice of the economic pie than policies that favor economic growth. D. a and c E. b and c
How could transferable pollution rights lead to pollution being reduced at the lowest possible opportunity cost?
A country's real GDP rose from $500 to $530 while its nominal GDP rose from $600 to $700 . What was this country's inflation rate?
a. 16.7%. b. 10.0%. c. 15.0%. d. -9.1%.