Solve the problem.The following data represents the normal monthly precipitation for a certain city. 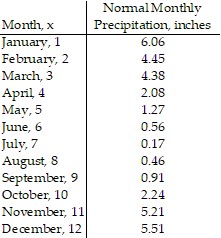 Draw a scatter diagram of the data for one period. Find a sinusoidal function of the form
 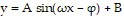 that fits the data. Draw the sinusoidal function on the scatter diagram. Use a graphing utility to find the sinusoidal function of best fit. Draw the sinusoidal function of best fit on the scatter diagram.
What will be an ideal response?
y = 3.14 sin(0.46x + 1.53) + 3.16;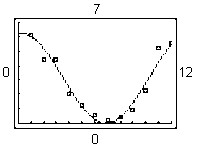
Mathematics
You might also like to view...
Integrate the function.
A.  + C
+ C
B. 6 ln + C
+ C
C. x + ln + C
+ C
D. 6 ln + C
+ C
Mathematics
The first several terms of a sequence are given. Find the indicated partial sum.-  ,
,  , -
, -  ,
,  , . . . ; S5
A. - 
B. - 
C. - 
D. - 
Mathematics
Provide an appropriate response.Determine whether the ordered pair is a point on the graph of the equation  a. (3, 5) b. (3, -5) c. (5, 5)
A. a. yes b. yes c. no B. a. yes b. no c. yes C. a. no b. no c. no D. a. yes b. no c. no
Mathematics
Multiply or divide.(-12)(-8)
A. 104 B. -108 C. 108 D. 96
Mathematics