First, create a scatter plot for the data in the table. Then, use the shape of the scatter plot given to determine if the data are best modeled by a linear function, an exponential function, a logarithmic function, or a quadratic function.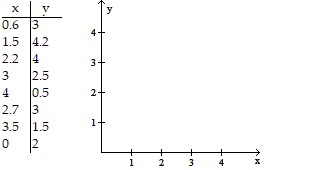
A. 
linear function
B. 
logarithmic function
C. 
exponential function
D. 
quadratic function
Answer: D
Mathematics
You might also like to view...
Find the area of the surface generated by revolving the curves about the indicated axis.x = t + 2 , y =
, y =  + 2
+ 2 t, - 2
 ? t ? 2
 ; y-axis
A. 114?
B.  ?
?
C. 228?
D. 342?
Mathematics
Identify the number as prime, composite, or unit.163
A. Prime B. Unit C. Composite
Mathematics
Multiply.0.092(0.68)
A. 6.256 B. 0.06256 C. 0.0006256 D. 0.006256
Mathematics
Provide an appropriate response.If X is normally distributed with ? = 60 and ? = 5, find P(X > 72).
A. 0.0123 B. 0.2968 C. 0.4918 D. 0.0082 E. 0.2731
Mathematics