Assuming the market is in equilibrium in the graph shown with demand D and supply S1, total surplus is:
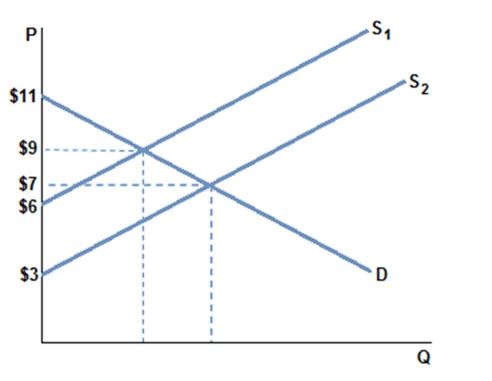
A. greater than total surplus when market is in equilibrium at D and S2.
B. less than total surplus when market is in equilibrium at D and S2.
C. the same as total surplus when market is in equilibrium at D and S2.
D. zero.
B. less than total surplus when market is in equilibrium at D and S2.
You might also like to view...
What will happen to a country that fixes the price of foreign exchange below equilibrium?
Applying a price of labor to the law of diminishing returns generates
a. the law of increasing costs b. less output as more labor is hired c. differences in the quality of labor d. a negatively-sloped labor supply curve e. specialization and the division of labor
A seller's reservation price is generally equal to:
A. the market price. B. the seller's marginal benefit from producing an additional unit. C. the buyer's reservation price. D. the seller's opportunity cost of producing an additional unit.
Refer to Scenario 1.1 below to answer the question(s) that follow.SCENARIO 1.1: An economist wants to understand the relationship between minimum wages and the level of teenage unemployment. The economist collects data on the values of the minimum wage and the levels of teenage unemployment over time. The economist concludes that a 1% increase in minimum wage causes a 0.2% increase in teenage unemployment. From this information he concludes that the minimum wage is harmful to teenagers and should be reduced or eliminated to increase employment among teenagers.Refer to Scenario 1.1. A graph of the value of the minimum wage on one axis and the level of teenage unemployment on the other axis is an example of
A. an economic theory. B. inductive reasoning. C. an economic model. D. a variable theory.