Refer to the information provided in Figure 19.1 below to answer the question(s) that follow. 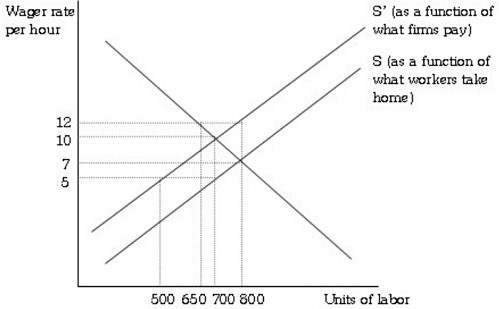 Figure 19.1 Refer to Figure 19.1. The payroll tax imposed is ________ per unit of labor.
A. $2
B. $3
C. $5
D. $10
Answer: C
You might also like to view...
In the graph shown below, if the market demand were to shift right, which of the following would occur for the firm? 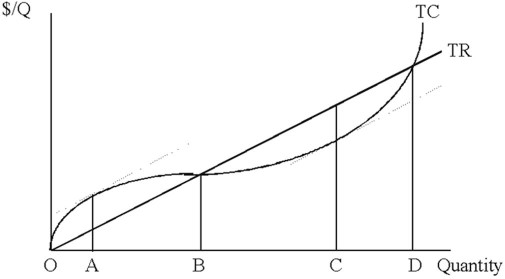
A. The total cost curve would shift downward. B. The total revenue function would rotate downward. C. The total revenue function would rotate upward. D. The firm would produce less output.
Would a shift in demand have a greater effect on the percentage change in equilibrium quantity for a straight-line supply curve that intersects the quantity axis or the price axis?
A. Price axis because supply will be more elastic. B. Quantity axis because supply will be less elastic. C. Quantity axis because supply will be more elastic. D. Price axis because supply will be less elastic. References
Consider a two-country, two-commodity model. The table below shows the units of Good X and Good Y produced in Country A and Country B per labor hour. If Country A transfers one labor hour from the production of Good Y to the production of Good X, total world production of Good X will ________ by ________ unit(s). ProductivityCountry ACountry BGood X1.000.50Good Y0.200.70
A. decrease; 0.7 B. increase; 0.5 C. increase; one D. decrease; 1.43
Considering a put option; if the price of the underlying asset increases:
A. the value of the put option also increases. B. the time value of the option decreases. C. the intrinsic value of the option increases. D. the value of the option decreases.