Which of the following plots is most appropriate for quantitative data?
A. Count Plot
B. Bar Chart
C. Stem-and Leaf
D. Pie chart
Answer: B. Bar Chart
Mathematics
You might also like to view...
Solve the problem.The number of bacteria growing in an incubation culture is given by  where x is time in days. Find the number of bacteria when x = 0 and x = 5.
A. 2300, 62,100 B. 2300, 34,500 C. 2300, 558,900 D. 6900, 558,900
Mathematics
Find the oblique asymptote, if any, of the rational function.f(x) = 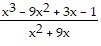
A. y = x B. None C. y = x + 12 D. y = x - 18
Mathematics
Graph the inequality.y ? -2x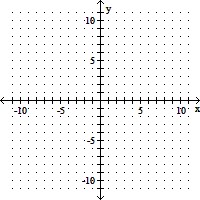
A. 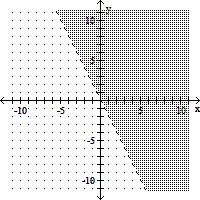
B. 
C. 
D. 
Mathematics
Multiply, then simplify the product. Assume that all variables represent positive real numbers.( - 5)(
- 5)( - 7)
- 7)
A.  + 35
+ 35
B.  - 7
- 7 - 5
- 5 + 35
+ 35
C. -11 + 35
+ 35
D.  - 12
- 12 + 35
+ 35
Mathematics