Refer to the information provided in Table 21.2 below to answer the question(s) that follow. Table 21.2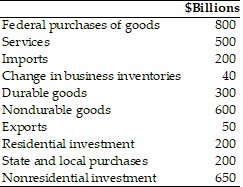 Refer to Table 21.2. Personal consumption expenditures in billions of dollars are
A. 900.
B. 1,100.
C. 1,400.
D. 1,600.
Answer: C
You might also like to view...
Give a specific example that shows clearly how the System of National Accounts endorsed by the United Nations fails to properly capture activity that harms the environment. Now, suggest a way to quantitatively correct the flaw in the particular case that you describe in part (a).
What will be an ideal response?
Just as indifference maps represent consumer tastes, so isoquant maps represent a producer tastes.
Answer the following statement true (T) or false (F)
If goods x and y are complements, then the cross price elasticity of demand between them will be:
a. positive. b. negative. c. zero. d. infinity.
Time lags that often erode effectiveness of monetary and fiscal policy measures represent
A. the foreign response to price changes. B. delays in the response of the economy to stabilization policy. C. the change in export and import prices. D. the change in exchange rates.