Exhibit 1A-9 Multi-curve graph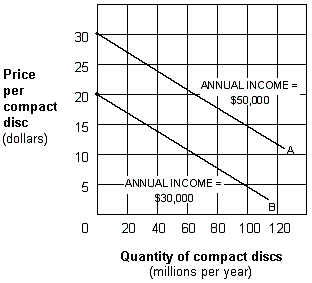
Exhibit 1A-9 represents a three-variable relationship. As the annual income of consumers falls from $50,000 (line A) to $30,000 (line B), the result is a:
A. rightward movement along each curve.
B. leftward movement along each curve,.
C. leftward shift from curve A to curve B.
D. rightward shift from curve B to curve A.
Answer: C
You might also like to view...
Refer to the figure below.________ inflation will eventually move the economy pictured in the diagram from short-run equilibrium at point ________ to long-run equilibrium at point ________. 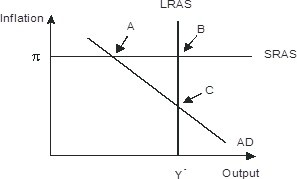
A. Rising; A B. Falling; A; C C. Falling; B: C D. Rising; A; C
The arithmetic value of (1 - MPC) equals
A) MPS. B) APS. C) APC. D) NDP.
In which of these developing regions has food production per capita steadily fallen over the last quarter century?
(a) Africa. (b) East Asia. (c) South Asia. (d) Latin America.
A deposit outflow results in equal reductions in
A) loans and reserves. B) assets and liabilities. C) reserves and capital. D) assets and capital.