Refer to Figure 5-7. The marginal benefit of reducing pollution curve is the same curve as
A) the supply of pollution reduction curve. B) the demand for pollution reduction curve.
C) the external benefit curve. D) the positive externality curve.
B
You might also like to view...
Refer to Figure 8.2. Holding other variables constant, a decrease in households' wealth will result in a
A) movement from point A to point B. B) movement from point B to point A. C) shift from curve S1 to curve S2. D) shift from curve S2 to curve S1.
In the GDP accounts production equals
a. income. b. income + saving. c. income - government expenditures. d. income - imports.
In Figure 9-13, assume the initial equilibrium at point A is disturbed by an increase in demand. If long-run equilibrium is established at point C, this is a(n)
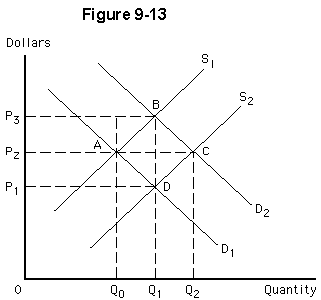
a.
constant cost industry
b.
increasing-cost industry
c.
decreasing-cost industry
An emission fee levied against polluters will tend to:
A. internalize the internal cost of pollution. B. externalize the internal cost of pollution. C. externalize the external cost of pollution. D. internalize the external cost of pollution.