Using MATLAB (or an equivalent mathematical computer tool) graph the signal,
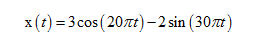
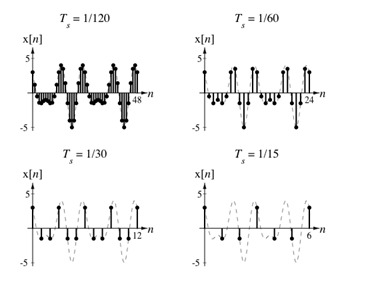
over a time range of 0 < t < 400 ms. Also graph the signal formed by sampling this function at the following sampling intervals:
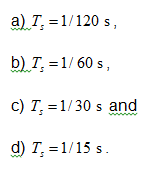
Based on what you observe what can you say about how fast this signal should be sampled so that it could be reconstructed from the samples?
You might also like to view...
Your company is trying to reduce energy costs for one of its warehouses by improving its insulation. Two options are being considered and it is up to you to recommend either urethane foam or fiberglass insulation. Use a 12-year analysis period and an interest rate of 7 percent. The initial cost of the foam will be $37 000 and it will have to be painted every three years at a cost of $3 000. The energy savings is expected to be $6 500 per year. Alternatively, fiberglass batts can be installed for $14 000 with no maintenance costs. Fiberglass batts will likely save $2 600 per year in energy costs.
What will be an ideal response?
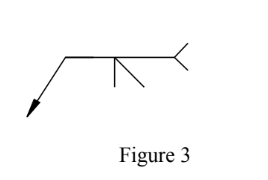
What kind of weld is required by the welding symbol shown in Figure 3?
a. Slot
b. Bevel groove
c. Plug
d. Fillet
The three sections of switchgear enclosures are the front section, the bus section, and the _____.
a. interrupter section b. unit substation c. cubicle section d. cable or termination section
How can you check the clamp-on ammeter?
What will be an ideal response?