Figure 7-12
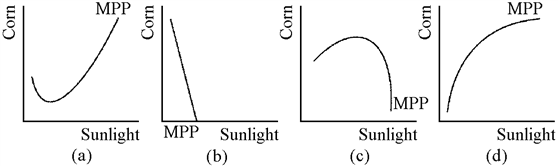
Which of the graphs in Figure 7-12 shows a marginal physical product curve that exhibits first increasing, and then diminishing, marginal returns to sunlight?
a.
(a)
b.
(b)
c.
(c)
d.
(d)
c
You might also like to view...
Economic growth in the United States has increased consistently since the 1950s.
Answer the following statement true (T) or false (F)
An increase in growth rates will cause the production possibilities curve to
A) shift inward. B) become steeper. C) become flatter. D) shift outward.
Neoclassical growth theory emphasized how __________ contribute to growth
A) the resources labor and capital B) technological changes C) government policies D) factors limiting population growth
When one market reaches a new equilibrium, the general equilibrium condition has been satisfied.
Answer the following statement true (T) or false (F)