Exhibit 15-1 Production possibilities curves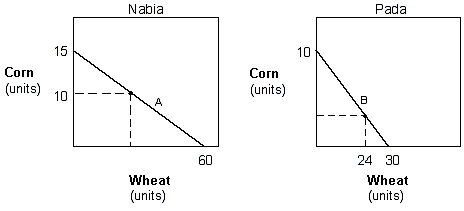
In Exhibit 15-1, the production possibilities curves of wheat and corn for Nabia and Pada are presented. Suppose Pada produces at point B on its PPC. How much corn is the country able to produce?
A. 2.
B. 15.
C. 10.
D. 6.
Answer: A
You might also like to view...
If government spending increases, which of the following would be most likely in the short and in the long run? (Both comparisons are with regard to the original price level/output combination.)
a. Short-run increases in the price level, no change in output; long-run increases in output and in the price level b. Short-run increases in output and in the price level; long-run increase in output, decrease in the price level c. Short-run decreases in output and in the price level; long-run increase in the price level, no change in output d. Short-run increases in output and in the price level; long-run increase in the price level, no change in output e. Short-run decreases in output and in the price level; long-run decreases in output and in the price level
Some argue that a nation should not depend too heavily on other countries for supplies of certain key products, special materials, or technologies that might have ______________ applications.
a. general b. scientific c. national security d. international
A headline reads "Lumber Prices Up Sharply." In a competitive market, this situation would lead to a(n):
a. Increase in the price of new homes and decrease in quantity b. Decrease in the price of new homes and increase in quantity c. Decrease in the price and quantity of new homes d. Increase in the price and quantity of new homes
If eight lemons (low quality) and two plums (high quality) are supplied and buyers assume that there is a 40% chance of getting a lemon, there is an equilibrium.
Answer the following statement true (T) or false (F)