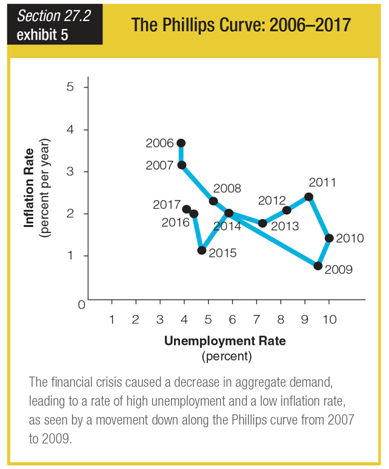
From the graph showing the Phillips curve from 2006 to 2016, we can see that the 2008 financial crisis caused ______.
a. high inflation rates and low unemployment rates
b. low inflation rates and high unemployment rates
c. high inflation and unemployment rates
d. low inflation and unemployment rates
b. low inflation rates and high unemployment rates
You might also like to view...
If an overvalued currency is allowed to float:
A) its quantity demanded in exchange for the other currency will decrease. B) its quantity supplied in exchange for the other currency will increase. C) its value will depreciate. D) its value will appreciate.
As Rainclouds Inc moves downward along its production possibilities frontier, illustrated in the figure above, the opportunity cost of a raincoat ________
A) decreases B) depends on the initial quantity produced C) increases D) remains the same
Why does inflation make nominal GDP a poor measure of the increase in total production from one year to the next?
What will be an ideal response?
The legislation overturning the Glass-Steagall Act is
A) the McFadden Act. B) the Gramm-Leach-Bliley Act. C) the Garn-St. Germain Act D) the Riegle-Neal Act.