Solve the problem.This chart shows the number of meals served in a restaurant during each of the past 4 months. Assume that the information in the chart defines a function with the name g. Find g(March). 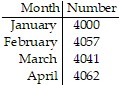
A. 4041 meals
B. 4000 meals
C. 4062 meals
D. 4057 meals
Answer: A
You might also like to view...
Which type of average is not the best choice for the following data? Data Values Frequency 22 1 23 3 24 2 32 2 33 3 34 1 ?
A. ?The mean; Split data will change the total sum of data values. B. ?The median; Split data in the middle will give a median value which is unlike the values around it. C. ?The mode; Split data in the middle will give a mode value which is unlike the values around it. D. ?Both the mean and the mode; Split data will give different a different mean and a different mode. E. ?None of the above.
A cannonball fired from the origin follows the graph of
 .
.
Here x denotes the distance downrange, and y denotes the height of the cannonball. Both are measured in feet.
?
A: Make a graph of y versus x. In choosing a viewing window, bear in mind that the cannonball follows the graph only until it strikes the ground.B: How far downrange does the cannonball strike the ground? Round your answer to two decimal places, if necessary.C: How far downrange does the cannonball reach its maximum height? Round your answer to two decimal places, if necessary.D: What is the maximum height the cannonball reaches? Round your answer to two decimal places, if necessary.
What will be an ideal response?
Find those values of x for which the given function is increasing and those values of x for which it is decreasing.y = x4 - 8
A. Increasing for -2 < x < 2, decreasing for x < -2, x > 2 B. Increasing for -2 < x < 0, x > 2, decreasing for x < -2, 0 < x < 2 C. Increasing for x < -2, x > 2, decreasing for -2 < x < 2 D. Increasing for x < -2, 0 < x < 2, decreasing for -2 < x < 0, x > 2
Provide an appropriate response.Find the area of the given figure.
A. 175.99 in2 B. 148.59 in2 C. 171.99 in2 D. 152.59 in2