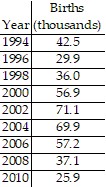
Solve the problem.The table below gives the number of births, in thousands, to females over the age of 35 for a particular state every two years from 1994 to 2010.  Use technology to find the quartic function that is the best fit for this data, where x is the number of years after 1994. According to the model, how many births were there to females over the age of 35 in this state in 2014?
A. 106,368
B. 108,868
C. 94,368
D. 101,318
Answer: A
Mathematics
You might also like to view...
Find the area.A parallelogram with a base of 33 ft and a height of 25 ft
A. 825 ft2 B. 823 ft2 C. 1089 ft2 D. 625 ft2
Mathematics
Construct a truth table for the statement.~r ? ~q
A. 
| T | T | F |
F T F
F F F
B.

| T | T | F |
F T F
F F T
C.

| T | T | F |
F T T
F F T
D.

| T | T | T |
F T F
F F T
Mathematics
Solve.Given log b 3 = 0.8397 and log b 7 = 1.4873, evaluate log b 3b .
A. 2.327 B. 1.12 C. 0.8397 D. 1.8397
Mathematics
Determine the type of conic that is the graph of the equation.y2 - 2x2 + 2x + 4y + 2 = 0
A. hyperbola B. not a conic C. parabola D. ellipse
Mathematics