Refer to the following graphs.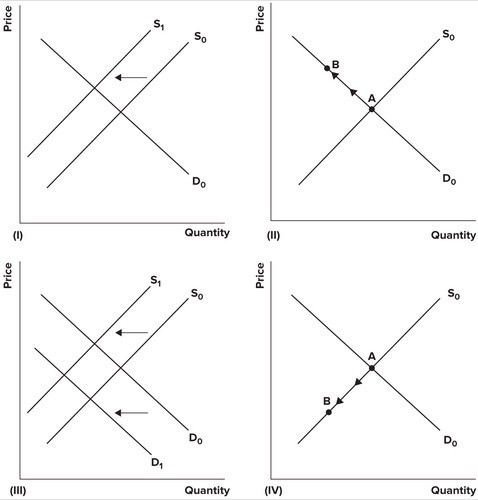 A recent report indicated that 50 intensive-care unit patients die for every 1,000 who are managed with a heart device known as the right heart catheter. Suppose as a result, the FDA limited supply of the heart catheters. The effect of the report and subsequent action by the FDA on the market for right heart catheters is best shown by which of the graphs?
A. I
B. II
C. III
D. IV
Answer: C
You might also like to view...
In 2-input production models, constant returns to scale implies horizontal marginal cost curves.
Answer the following statement true (T) or false (F)
Monetarists argue that an exogenous increase in investment spending is likely to be offset by a decrease in
A) the money supply. B) interest rates. C) government spending. D) consumption.
The quality of a product
A) is usually unknown to the seller and the buyer. B) leads to adverse selection. C) creates noise in a market. D) is a hidden characteristic.
Paradoxically, when the economy most needs injections of money, the economic conditions are such that
a. borrowers are particularly eager to go to banks for loans b. borrowers are most reluctant to borrow (demand loans) from banks c. the FDIC will insist that banks raise the interest rate they charge borrowers d. the FSLIC and FDIC will insist that banks lower the interest rate they charge borrowers e. the Federal Reserve will print less money