On the graph above, at the point where quantity demanded equals quantity supplied (let's call it point A), the economy has reached its ________
A) general equilibrium, and barring any shocks, it will not move from A
B) long-run equilibrium, and barring any shocks, it will not move from A
C) short-run equilibrium, and even without any shocks, it may move away from A
D) short-run equilibrium, and barring any shocks, it will not move from A
E) none of the above
C
You might also like to view...
The relationship between the overall price level in the economy and total production by firms is shown in the:
A. aggregate demand curve. B. aggregate supply curve. C. inflation rate. D. business cycle.
If the dollar used to buy 100 yen and now buys 360 yen, there has been
A) appreciation of the dollar. B) depreciation of the dollar. C) appreciation of the yen. D) an increase in special drawing rights.
Refer to the information provided in Figure 13.10 below to answer the question(s) that follow. 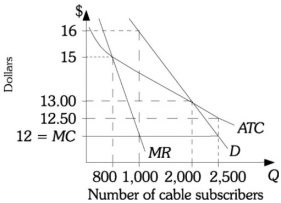 Figure 13.10 Refer to Figure 13.10. If the government imposed a ________ on this firm, the firm would sell to 2,500 subscribers but would require a subsidy of $1,250 to stay in business.
A. price floor of $12 B. price ceiling of $12.50 C. price floor of $12.50 D. price ceiling of $12
Use the classical (RBC) IS-LM-FE model to show the effects on the economy of a temporary beneficial supply shock; for example, a decrease in the price of oil. You should show the impact on the real wage, employment, output, the real interest rate, consumption, investment, and the price level.
What will be an ideal response?