Exhibit 14-7 Aggregate supply and demand curves
?
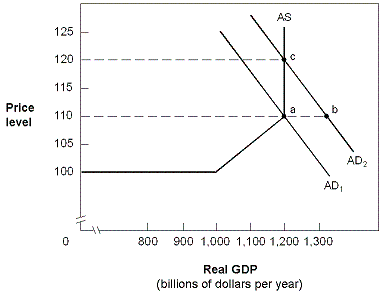
At point A in Exhibit 14-7, the aggregate demand AD2 and the aggregate supply curve reflect an economy in which
A. full employment is at $1,000 billion GDP.
B. excess aggregate supply is created when there is a shift from AD1 to AD2.
C. excess aggregate demand forces prices up to P = 120.
D. excess aggregate demand causes prices to stabilize at P = 110.
Answer: C
You might also like to view...
At the midpoint of a straight-line demand curve, the price elasticity of demand is:
A. greater than one. B. zero. C. less than one. D. equal to one.
A tariff is a:
a. tax on an exported product. b. limit on the number of goods that can be exported. c. limit on the number of goods that can be imported. d. tax on an imported product. e. subsidy on an imported product.
The accompanying figure shows the demand curve for a product that can be sold only in whole-number amounts.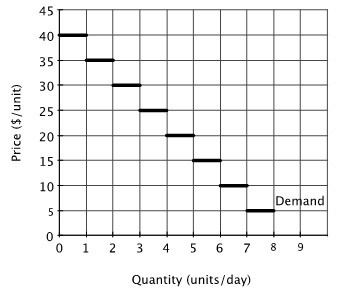 What is the maximum price that any buyer would be willing to pay for the first unit?
A. 15 B. 25 C. 35 D. 40
Easy entry of new firms is not a characteristic for ________ industries.
A. monopolistically competitive and oligopolistic B. oligopolistic and monopolistic C. perfectly competitive and monopolistically competitive D. monopolistic and perfectly competitive