In this example, why is the graph for total utility curved whereas the graph for marginal utility is straight?
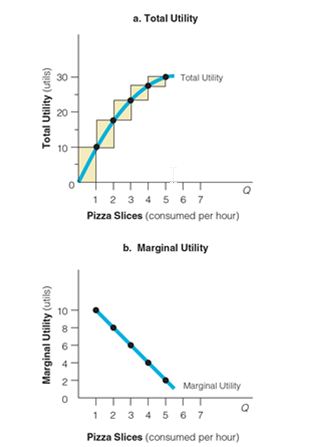
a. Total utility has a constant positive slope whereas marginal utility has a constant negative slope.
b. The slope of the total utility graph is positive but constantly decreasing at the rate shown on the marginal utility graph.
c. The slope of the marginal utility graph is negative but constantly increasing at the rate show on the total utility graph.
d. Marginal utility has a constant positive slope whereas totally utility has a constant negative slope.
b. The slope of the total utility graph is positive but constantly decreasing at the rate shown on the marginal utility graph.
You might also like to view...
Surplus value that is lost because something is keeping the market from functioning as well as it can is known as ________
Fill in the blank(s) with correct word
The Bertrand model of price setting assumes that a firm chooses its price
A) independently of what price other firms charge. B) subject to what price rival firms are charging. C) so that joint profits are maximized. D) without considering the shape of the demand curve.
If the price of an input decreases, each individual firm's ________ shifts downward and the ________ shifts to the right.
A. demand curve; industry supply curve B. marginal cost curve; industry supply curve C. marginal revenue curve; marginal cost curve D. supply curve; marginal cost curve
If the interest rate received in Mexico is greater than that obtained in the United States,
A) the interest rate will decrease in the United States in the future. B) the interest rate will increase in the United States in the future. C) the interest rate will increase in Mexico in the future. D) the interest rate will not change in either country.